

Here’s How America Uses Its Land
There are many statistical measures that show how productive the U.S. is. Its economy is the largest in the world and grew at a rate of 4.1 percent last quarter, its fastest pace since 2014. The unemployment rate is near the lowest mark in a half century.
What can be harder to decipher is how Americans use their land to create wealth. The 48 contiguous states alone are a 1.9 billion-acre jigsaw puzzle of cities, farms, forests and pastures that Americans use to feed themselves, power their economy and extract value for business and pleasure.


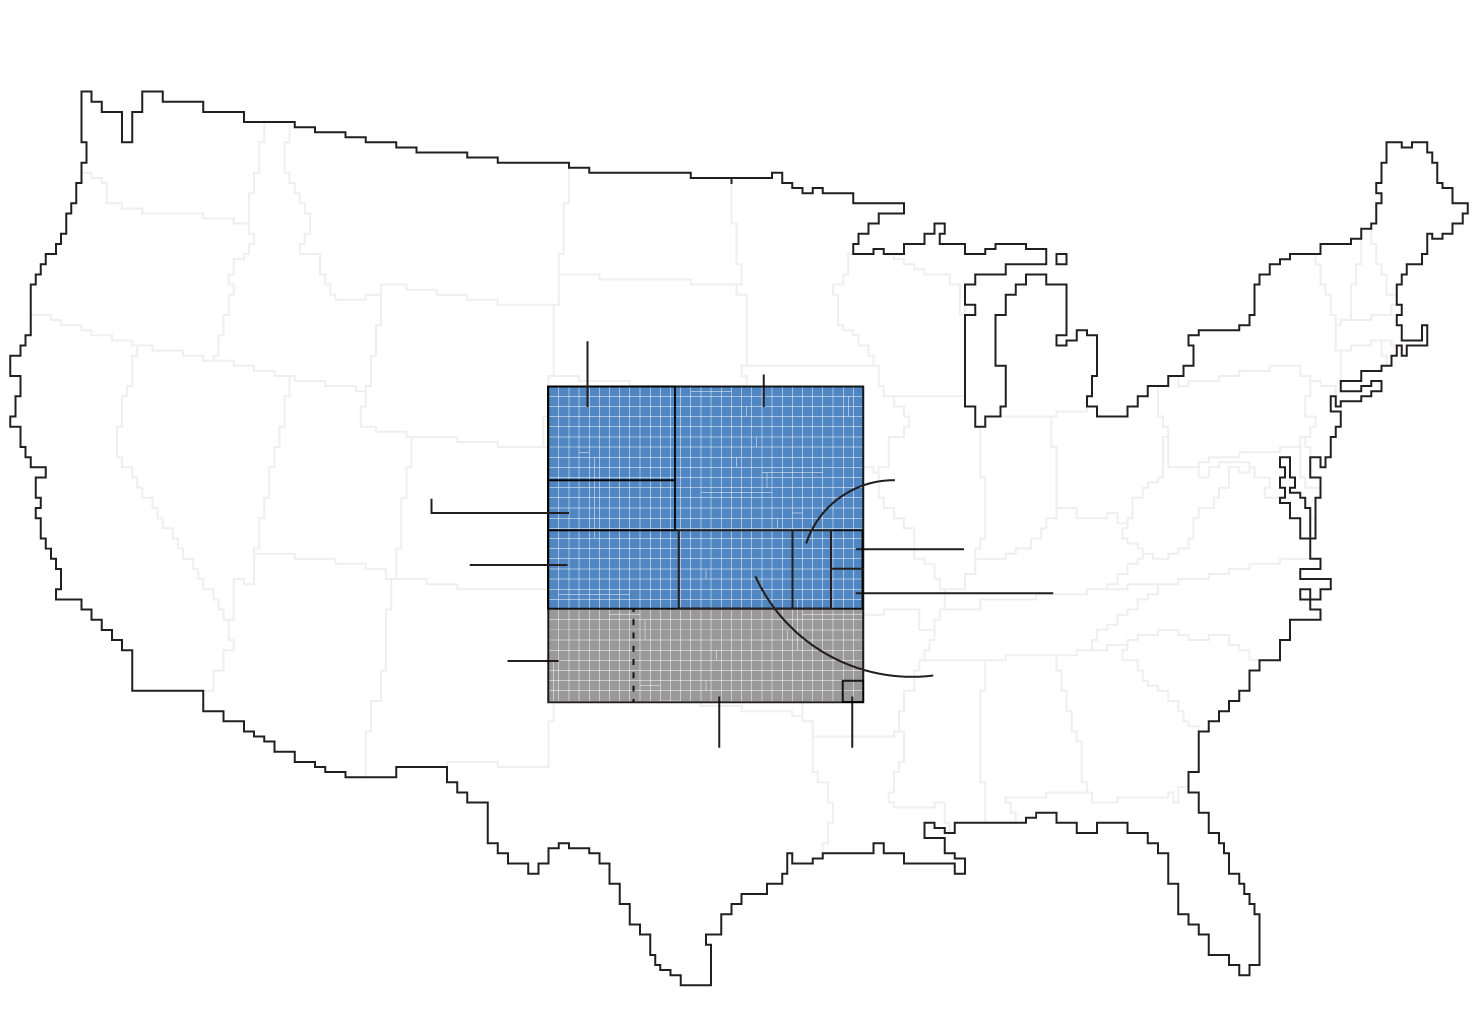


Methodology Land use classifications are based on data published in 2017 by the U.S. Department of Agriculture’s Economic Research Service in a report called the Major Uses of Land in the United States (MLU). Data from the report provide total land-use acreage estimates for each state across six broad categories. Those totals are displayed per 250,000 acres.
Data from Alaska and Hawaii are excluded from the analysis. Special-use land and forestland make up the biggest land types in those states.
Bloomberg referenced the USDA data against estimates from the National Land Cover Database to generally locate these categories within each state.
Miscellaneous uses are defined as wetlands, rural residential lands, non-harvestable forests, desert, tundra and barren land of low economic value. Unlike all other land-use categories in the USDA data, a component breakdown for miscellaneous uses by state is not provided in the MLU.
To locate miscellaneous areas, Bloomberg referred to the National Land Cover Database to generally calculate and locate acreage by miscellaneous uses. “Rural residential lands” in the USDA data make up most of the 69 million-acre miscellaneous-use category. This category does not equally correlate to data in the National Land Cover Database, so Bloomberg subtracted the total of the other miscellaneous components to arrive at a rough estimate of “rural residential lands”—about 50 million acres.
Total pasture/range areas are proportionally divided by animal group based on National Agricultural Statistics Service livestock counts.
Data showing the 100 largest landowning families are based on descriptions of acreage and land type in The Land Reportmagazine. Representative amounts of acreage were subtracted from private timber and cropland/range to show this category, which is not a part of the USDA data.
Sources: U.S. Department of Agriculture, Economic Research Service: Major Uses of Land in the United States, 2012; U.S. Department of the Interior, National Land Cover Database, 2011; U.S. Census Bureau; State governments; stateparks.org; American Farmland Trust; Golf Course Superintendents Association of America; USDA National Agricultural Statistics Service; USDA Census of Agriculture; U.S. Bureau of Land Management; U.S. Forest Service; Weyerhaeuser Co.; The Land Report magazine